
What does an options probability calculator show?
An options probability calculator estimates the chance that a call finishes above its strike or a put finishes below its strike on the expiration date. Most versions use a log-normal price distribution and inputs such as the current underlying price, strike, days to expiration, implied volatility, interest rate, and sometimes dividend yield.
The output is a conditional estimate. It answers a narrow question such as “what is the model-implied probability of finishing in the money?” It does not say whether the trade is attractive, whether the price will move smoothly, or whether the option will be profitable after premium, fees, slippage, assignment, and taxes.
Start with the probability you actually need
The phrase probability can hide several different questions. Probability of ITM asks whether the option has intrinsic value at expiration. Probability of OTM is its complement. Probability of profit moves the threshold to the strategy breakeven, so it includes the premium paid or received. Probability of touch asks whether price reaches a level at any time before expiration, which is a path question rather than a terminal question.
For a long call, the ITM threshold is the strike, while the profit threshold is usually strike plus premium. For a long put, the profit threshold is strike minus premium. For a credit spread, the profitable region may be a range between two strikes. A useful calculator or article should name the threshold on every result instead of presenting one percentage without context.
The distinction matters because a trade can finish ITM and still lose money. An option that costs $4.00 must recover that debit before it has positive expiration profit. Conversely, a short option can finish OTM and keep premium, but the seller still faces margin, assignment, gap, and tail-risk considerations before expiration.
| Measure | Question answered | Typical threshold |
|---|---|---|
| Probability ITM | Is there intrinsic value at expiration? | Strike |
| Probability OTM | Does the option expire without intrinsic value? | Opposite side of strike |
| Probability of profit | Is expiration P/L at or above zero? | Breakeven after premium |
| Probability of touch | Does price reach a level before expiry? | Target or stop level |
Use inputs that match the option contract
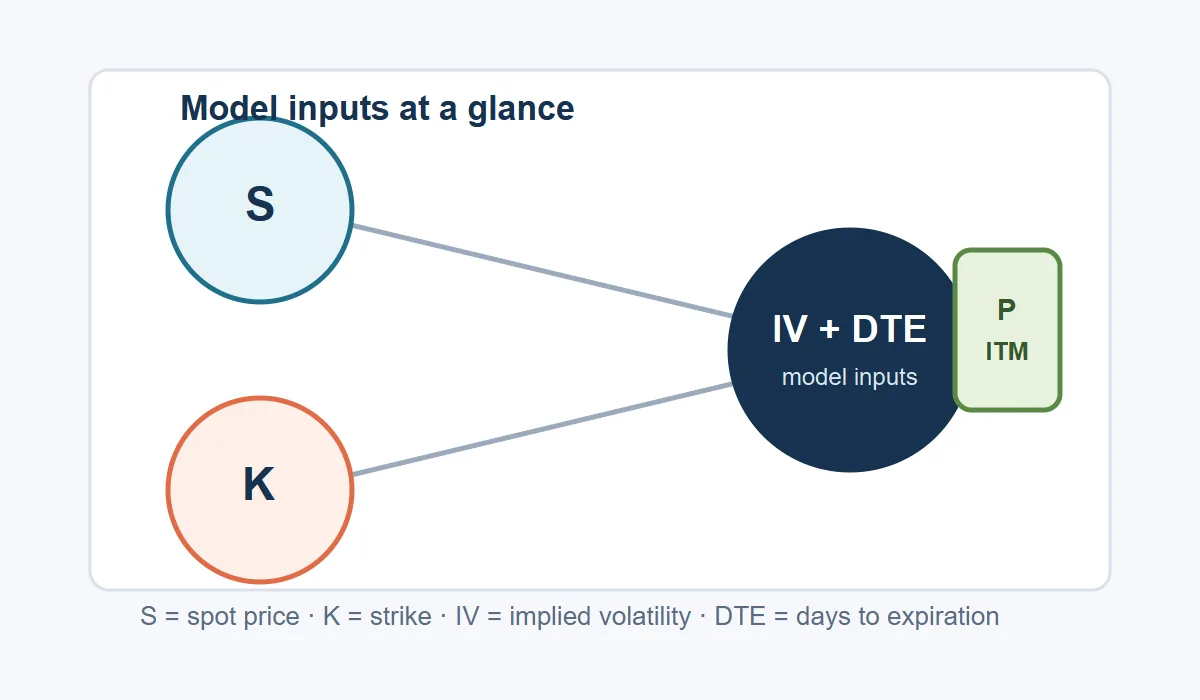
Spot price is the current or scenario price of the underlying. Strike is the exercise level. Days to expiration should be measured consistently; a model normally converts calendar days into years by dividing by 365. Implied volatility is annualized and should come from the same expiration and contract family you are analyzing. Mixing IV from a different maturity can make the output look precise while describing the wrong distribution.
Rates and dividends affect the risk-neutral drift. For a quick educational estimate, many people leave them at zero, but that shortcut is less appropriate for dividend-paying stocks, index options, or longer maturities. American-style equity options can also behave differently from the European-style assumptions used by a simple Black-Scholes probability model.
- Spot price (S) and strike (K) define how far the option is from the money.
- Implied volatility (σ) controls the width of the modeled distribution.
- Days to expiration (T) controls how long the distribution has to spread.
- Rate (r) and dividend yield (q) adjust the modeled drift when supplied.
- Premium is required for probability of profit, even though it is not needed for basic ITM probability.
How the d2 probability formula works
A common Black-Scholes probability model calculates a standardized distance called d2. The normal cumulative distribution function N(d2) gives the modeled probability that a call finishes above the strike under risk-neutral assumptions. A put uses N(-d2) for the probability of finishing below its strike. The formula is compact, but every input carries a modeling choice.
T is time in years, not a raw day count. Volatility is expressed as a decimal, so 30% becomes 0.30. The drift term can include the risk-free rate and dividend yield. If the calculator omits those fields, it is making a simplifying assumption rather than discovering a hidden market fact.
Expected move is a related but different output. A one-standard-deviation estimate is often approximated by spot multiplied by volatility and the square root of time. Under a normal approximation, about 68% of outcomes fall inside that band and about 95% inside two bands. Those percentages describe a distribution, not a guaranteed trading range.
d2 = [ln(S / K) + (r − q − 0.5 × σ²) × T] / (σ × √T); call P(ITM) = N(d2); put P(ITM) = N(−d2)Interpret ITM, profit, touch, and expected move together
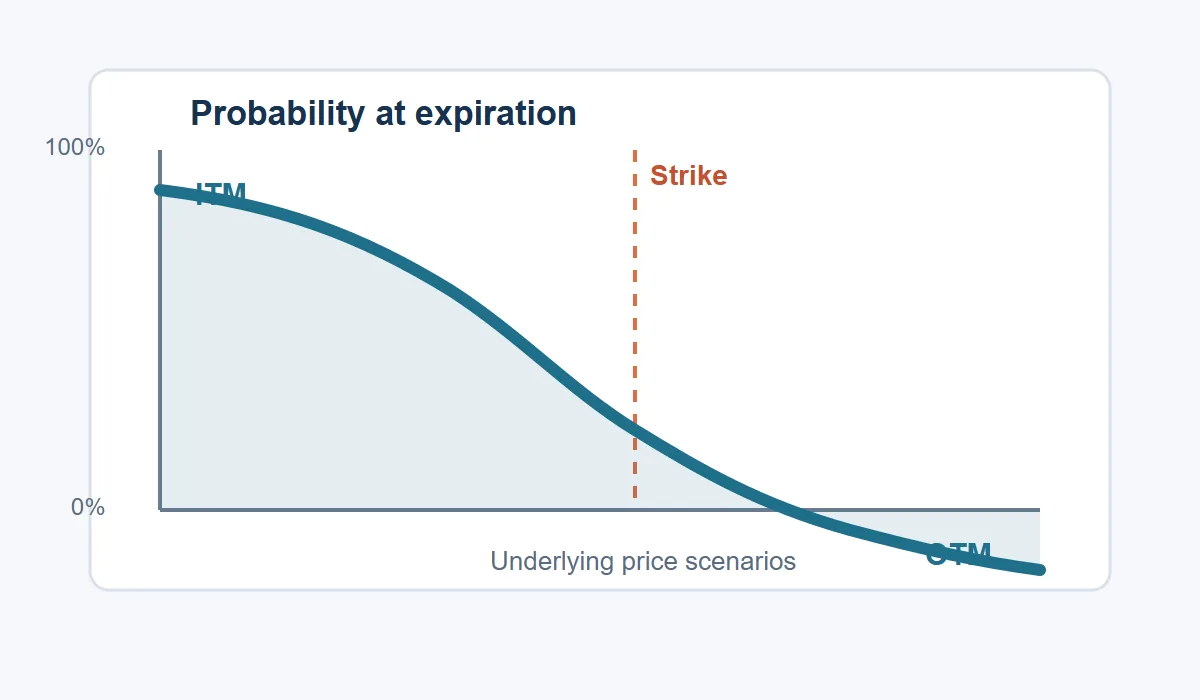
The most useful result panel makes the event explicit: “call finishes above $105 at expiration” is clearer than “probability 40%.” A scenario table can show the threshold and assumptions. If a chart displays a curve, label the strike and explain whether it is terminal probability or a path-based touch estimate.
Probability of touch is usually higher than probability of finishing ITM because price can visit a level and then move away. Probability of profit moves the threshold to breakeven, but it still does not measure expected value. Compare every percentage with maximum loss, payoff shape, liquidity, and capital at risk.
| Output | Use it to ask | Do not infer |
|---|---|---|
| ITM probability | Will intrinsic value exist at expiry? | That the trade is profitable |
| Profit probability | Will the strategy clear breakeven at expiry? | That the expected return is positive |
| Touch probability | Could price visit a level before expiry? | That it will finish there |
| Expected move | What range does IV imply? | A guaranteed high and low |
Why the estimate can disagree with reality
The model usually assumes a continuous market, a log-normal terminal distribution, constant volatility, and simplified interest and dividend inputs. Real markets have jumps, volatility smiles, skew, earnings gaps, changing rates, discrete dividends, trading halts, and liquidity gaps. Those effects can be material precisely when a position is most exposed.
The number also ignores your execution. Bid-ask spread, commissions, slippage, borrow costs, early exercise, assignment, and tax treatment can move the true result away from a clean formula. An American option may be exercised before expiration.
Use an options probability calculator as a transparent scenario aid. Save inputs and timestamp, recalculate when IV or time changes, and compare several strikes. Never use a high probability as permission to risk more than your plan allows.
- Treat risk-neutral probability as a market-implied estimate, not a real-world forecast.
- Check for stale IV, corporate actions, earnings dates, and unusual spreads.
- Read the contract multiplier and settlement rules before converting per-share output to dollars.
- The article and related calculator are educational and do not provide investment advice.
A 30-day call with a $105 strike
Assume a stock is at $100, the call strike is $105, implied volatility is 25%, and 30 calendar days remain. The option is five dollars out of the money. A simplified zero-rate, zero-dividend model converts 30 days to about 0.0822 years and produces a d2 near −0.72.
The normal CDF of that value is about 23.7% for a call finishing above $105. The complementary OTM estimate is about 76.3%. This is a terminal event estimate. It does not say the stock cannot trade above $105 during the month, and it does not include the premium needed to calculate profit.
- Confirm that the option is a call and that the strike and expiration match the quote.
- Enter spot $100, strike $105, 30 days, and IV 25% using consistent units.
- Read the event label: call finishes above $105 at expiration.
- If the premium is $2.00, evaluate profit probability at the $107 breakeven instead of at the $105 strike.
- Compare the estimate with the expected move and the maximum loss before making any decision.
A quick validation checklist
A workflow is deliberately repetitive. Record the contract first, then the market inputs, then the event being measured. If you cannot state the event in one sentence, pause before comparing percentages.
- Name the event: ITM, OTM, profit, touch, or expected move.
- Verify spot, strike, option type, expiration, multiplier, IV, rate, and dividend inputs.
- Convert days to years and percentages to decimals where the formula requires it.
- Check whether the price and IV are current, delayed, or manually entered.
- Compare probability with payoff, maximum loss, liquidity, and assignment risk.
- Save the timestamp and assumptions so the result can be audited later.
Options probability calculator FAQ
Is probability of ITM the same as probability of profit?
No. ITM uses the strike as the threshold. Profit probability uses the strategy breakeven after premium and can be much lower for a long option.
Why does implied volatility change the result?
IV controls the width of the modeled price distribution. Higher IV implies a wider range of terminal prices, so far strikes can receive more modeled probability while near strikes can move closer to the middle.
Does touch probability mean the stock will finish at the strike?
No. Touch asks whether price reaches a level at any point before expiration. The stock can touch the strike and finish far away from it.
What inputs matter most in a probability model?
Spot relative to strike, implied volatility, and time to expiration are usually the largest drivers. Rates and dividends matter more for dividend-paying underlyings and longer expirations.
Is an options probability calculator financial advice?
No. It is an educational estimate under assumptions. It does not assess suitability, predict prices, or guarantee a return.
Model references and page scope
The page structure was checked against current public calculator pages. Their formulas and examples are used as topic evidence, not copied as investment recommendations.
- CalcSuite · Options Probability Calculator — Shows ITM/OTM probability, expected move, variables, worked example, and FAQ.
- MoneyDeck · Option Probability Calculator — Separates ITM, touch, profit, expected move, formula, and practical examples.
- TradingCalcs · Options Probability Calculator — Explains d2, call and put formulas, worked calculations, and model limitations.