
What does an implied volatility calculator solve?
An implied volatility calculator finds the volatility input that makes a model price equal to a market option price. You provide the option type, premium, underlying price, strike, time to expiration, interest rate and, when relevant, dividend yield. The solver then searches for an annualized volatility, usually written as sigma or IV, that reproduces the quote within a small tolerance.
IV is not directly observed like the stock price. It is a model-derived number embedded in the premium, so it changes when price, time, rates, dividends or the pricing model changes. A high IV says that the quoted option price is expensive relative to the chosen assumptions; it does not guarantee a large move or say whether buying or selling the option is attractive.
This page is about the reverse problem: price to volatility. The option price calculator starts with IV and estimates a theoretical price, while a Greeks calculator measures sensitivity after inputs are set. Keeping those boundaries clear prevents a precise-looking IV from being mistaken for a forecast or a trade signal.
Inputs an implied volatility calculator needs
Start by matching the quote to one contract. Market price can mean last, bid, ask or midpoint; record which one you use because each produces a different IV. Spot price must be from the same underlying and currency. Strike, option type and expiration must describe the same series. A one-day mismatch can matter sharply for a near-expiration option.
Time to expiration is normally converted into years, such as 30 calendar days divided by 365. Some models use trading days or a business-day convention, so write down the convention instead of silently mixing calculators. Interest rate and dividend yield are annualized inputs. For a quick illustration they may be set to zero, but that is a simplifying assumption, not proof that rates and dividends are irrelevant.
The quote also needs a contract multiplier when you move from per-share values to dollars. The multiplier does not change the percentage IV, but it changes the cash value of the premium and the risk discussion. If a broker shows a stale quote, a wide spread or an adjusted contract after a corporate action, the solver can return a mathematically valid number that describes an unusable market input.
- Option price: choose bid, ask, last or midpoint and label the choice.
- Underlying price and strike: use matching units and the correct contract series.
- Time to expiration: convert days to the model's year fraction.
- Call or put: the payoff and price bounds are different for each type.
- Rate, dividend yield and multiplier: disclose assumptions before comparing results.
- Quote timestamp: an IV without a timestamp can hide a stale or wide market.
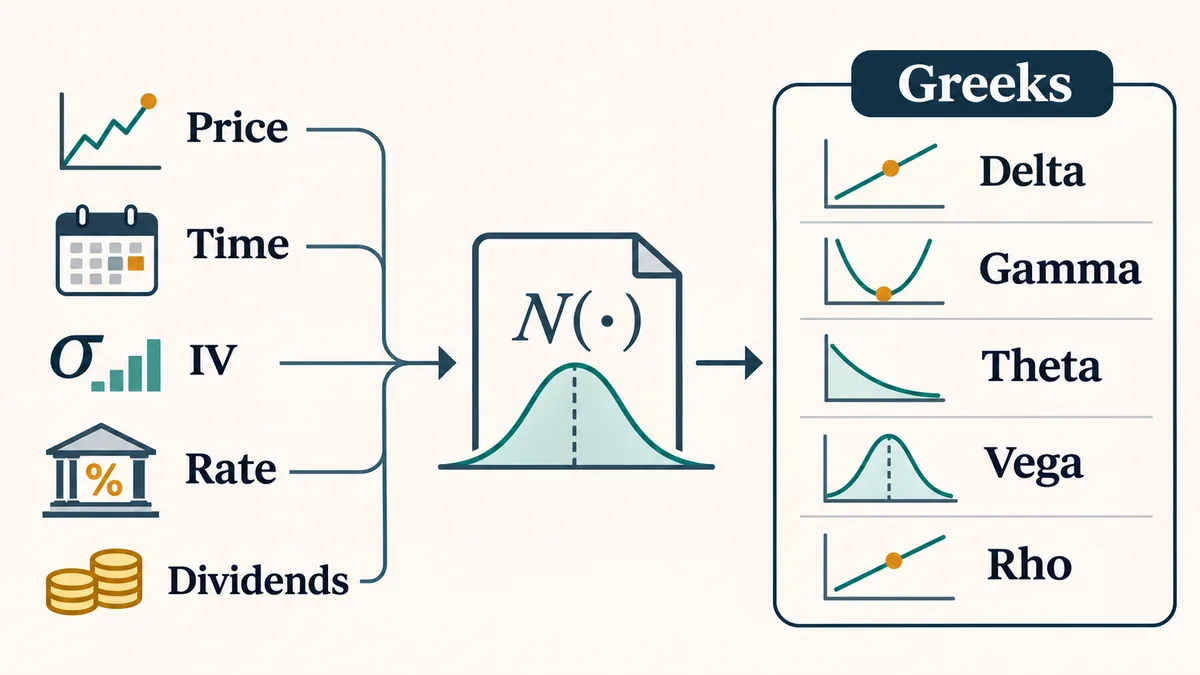
Implied volatility is a reverse pricing answer
A pricing model maps an assumed volatility to a theoretical option price. Implied volatility reverses that map: the observed premium is known, and volatility is the unknown. In a Black-Scholes or Black-Scholes-Merton setup, the other inputs remain fixed while the solver changes sigma until the model price and quote are close enough.
The result is forward-looking only in a market-implied sense. Traders may pay a larger premium before earnings, a product launch or a macro announcement because the distribution of possible outcomes feels wider. The resulting IV reflects the price people are willing to trade, plus supply, demand and risk transfer. It is not a clean survey of the future and it is not the same as realized volatility measured from historical returns.
IV is also a surface rather than one universal number. Options with different strikes and expirations can carry different implied volatilities. The pattern may show a smile or skew. Comparing a 30-day at-the-money IV with a 180-day out-of-the-money IV as if they were identical measures can lead to a false conclusion about what is cheap or expensive.
| Term | What it describes | What it does not prove |
|---|---|---|
| Implied volatility | Volatility that makes the selected model match the quote | A guaranteed future move |
| Realized volatility | Historical variation calculated from past returns | The premium the market will pay |
| Expected move | A range derived from IV and time | A hard high and low |
| IV rank or percentile | A comparison with a chosen historical IV sample | A universal valuation signal |
How the implied volatility formula is solved
There is usually no simple algebraic formula that isolates sigma in Black-Scholes. A calculator first evaluates a call or put price for a trial volatility, compares that price with the market premium, and changes the trial value. It repeats the process until the pricing error is below a tolerance or the iteration limit is reached.
Newton-Raphson is common because vega gives the slope of price with respect to volatility. A simplified update is new sigma = old sigma minus pricing error divided by vega. If vega is very small, the update can jump or become unstable, so robust tools cap the step and fall back to bisection. Bisection brackets a low and high volatility and repeatedly halves the interval, which is slower but easier to keep within sensible bounds.
The solver should expose a status, a residual or a recomputed model price. A result that says 42% without showing that the model price returns to the entered premium hides the most important quality check. If the premium is outside theoretical bounds, no positive volatility can solve it. If the quote is almost intrinsic value near expiration, tiny price changes can create very large IV changes.
modelPrice(S, K, T, sigma, r, q, callOrPut) = marketPrice; solve for sigma with Newton-Raphson or a bracketed search- Use decimal units inside the model: 30% IV becomes 0.30 and 5% interest becomes 0.05.
- Recalculate the model price with the returned IV and compare it with the original quote.
- Treat a non-converged, bounded or clipped result as a warning, not as a normal percentage.
- Keep the solver tolerance and maximum iterations visible when reproducibility matters.
How to interpret an IV result with price and Greeks
Read the event label before the percentage. “The midpoint implies 31% annualized volatility under Black-Scholes” tells you more than “IV 31%.” Check whether the price was bid, ask or midpoint, whether the result is annualized, and whether the model uses continuous or discrete dividends. Then compare the model's recomputed price with the entered quote.
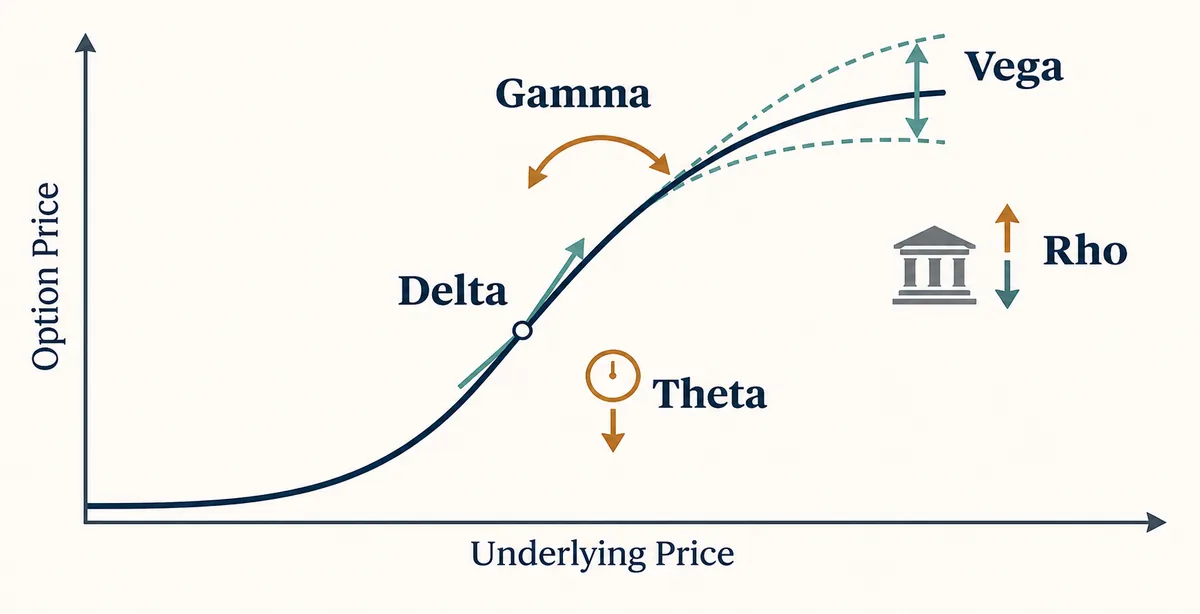
Intrinsic value is the immediate exercise value. Time value is the remaining premium after intrinsic value is removed. An option can have high IV because its time value is high, but a high percentage near expiration can also be a mathematical artifact of a tiny extrinsic price. Vega shows how much the model price changes for a one percentage-point IV move; it helps explain why two nearby premiums can imply different IVs.
Greeks are conditional on the solved IV. Delta, theta and vega will move if the quote, time or volatility surface moves. Use the sensitivity map as a scenario aid, not as a promise that one Greek will remain constant while the market changes. For a multi-leg position, solve or compare each leg consistently before combining exposures.
| Check | Question | Warning sign |
|---|---|---|
| Quote | Which market price did I use? | Last price far from bid and ask |
| Repricing | Does the returned IV reproduce the premium? | Large residual or hidden error |
| Units | Are time, rates and IV in expected units? | 30 entered instead of 0.30 |
| Surface | Is the comparison at the same strike and expiry? | Mixing tenors or skew points |
A simple call example from price to IV
Suppose the underlying is 100, a European-style call has a 105 strike, 30 calendar days remain, the market midpoint is 2.00, the annualized rate is 0% and the dividend yield is 0%. The intrinsic value is zero, so the entire 2.00 premium is time value. An implied volatility calculator starts with a trial sigma, prices the call, and adjusts sigma until the theoretical premium is close to 2.00.
The exact percentage depends on the model convention and numerical tolerance. The important observation is the workflow: the quote is the anchor, the returned IV is annualized, and a second calculation should reproduce the same 2.00 price. If you change the quote to 1.90, move expiration to 15 days or add a dividend yield, the implied volatility changes even though the ticker and strike look familiar.
A put example follows the same reverse process, but its price bound and sensitivity differ. For a spread, do not feed the net credit into a single-leg solver and call the result a spread IV; solve each leg or use a model built for the strategy and disclose the convention.
- Confirm call or put, spot 100, strike 105, expiration 30 days and premium 2.00.
- Convert 30 days to the selected year fraction and enter rates and dividends consistently.
- Run the solver and record IV, model price, residual and iteration status.
- Reprice the contract with the returned IV; the result should be close to 2.00.
- Repeat with bid and ask to see an IV range instead of treating one midpoint as truth.
When an implied volatility calculator can fail
A call or put price must sit within a no-arbitrage range for a positive volatility solution to exist. A price below intrinsic value, a stale quote, a negative time value caused by bad inputs, or a contract adjusted after a split can make the equation impossible or misleading. A calculator should show “no solution” or “check inputs” rather than quietly returning a capped value.
Black-Scholes assumes a simplified continuous market and often treats volatility, rates and dividends as constant. Real options have early exercise, discrete dividends, jumps, volatility skew, settlement rules and bid-ask costs. Index, futures and American equity options may need Black-76, a binomial tree or another model. Two honest calculators can therefore disagree because they use different models, calendars or quote sources.
Near expiration, vega can become small and IV becomes unstable: a few cents of spread noise can create a large percentage change. Around earnings, the IV may include event premium that collapses after the announcement. Treat the output as a timestamped scenario, save the inputs, and never increase position size merely because the solver returned a high or low probability-looking number.
- Check intrinsic value and theoretical upper and lower bounds before trusting a solution.
- Use the same quote source, timestamp, calendar and model when comparing IV values.
- Separate annualized IV from expected move; a 30% IV is not a guaranteed 30% price change.
- Account for spread, commissions, assignment, early exercise, taxes and contract multiplier.
- Treat model output as educational information, never as a recommendation or guarantee.
IV, realized volatility and expected move are different
Realized volatility looks backward at a return series. Implied volatility looks at the option price and asks what volatility would make the model fit. Expected move translates IV and time into a model range, often using spot multiplied by IV and the square root of time. These quantities can be compared, but they answer different questions and use different data.
A market can price high IV while recent realized volatility is quiet because traders expect an event. It can also price low IV after a sharp move if the market expects conditions to settle. A simple comparison therefore needs the same horizon, moneyness, quote convention and timestamp. Add IV rank or percentile only after defining the historical sample; a percentile from one year is not interchangeable with one from five years.
| Measure | Data direction | Useful question |
|---|---|---|
| Implied volatility | Option price to model input | What volatility is priced into this quote? |
| Realized volatility | Past returns to statistic | How variable was the underlying over the sample? |
| Expected move | IV and time to a range | What range does the assumption imply? |
| IV rank | Current IV versus history | Where is IV within the chosen lookback? |
A repeatable IV review in five checks
Before comparing an IV number across strikes or dates, write one sentence describing the event: “the midpoint of this 30-day 105 call implies annualized volatility under the selected model.” That sentence forces the quote, contract, horizon and model into view. Then record the model price returned by the solver so another person can reproduce the result.
The same discipline applies when reading a broker's option chain. IV may be calculated from bid, ask, mark or a smoothed surface, and the platform may use a different model for American exercise. A displayed percentage is useful only when its source and convention are understood.
- Name the exact option, quote type, timestamp and model.
- Verify spot, strike, expiration, rate, dividend and multiplier.
- Check intrinsic value, time value and the no-arbitrage price range.
- Confirm convergence and reprice with the returned IV.
- Compare like-for-like strikes and expirations before drawing a conclusion.
Implied volatility calculator checklist
Use this checklist when a result looks surprisingly high, low or different from a broker screen. The goal is not to force calculators to agree; it is to find which assumption explains the difference.
- Confirm call or put, strike, expiration and contract adjustment status.
- Record whether the premium is bid, ask, last, mark or midpoint.
- Use consistent units for days, rates, dividends and annualized volatility.
- Check intrinsic value, time value and theoretical price bounds.
- Read solver status, residual, iteration count and the recomputed model price.
- Compare the same moneyness and tenor; do not mix unrelated points on the IV surface.
- Save the timestamp and assumptions; IV can change without any change to the ticker.
Implied volatility calculator FAQ
Is implied volatility the same as expected volatility?
It is a market-implied model input, not a guaranteed forecast. It reflects the option price under stated assumptions and can include demand, supply and event risk.
Why does the same option have different IV on different sites?
Sites may use bid, ask, last or midpoint, different timestamps, calendars, rates, dividends, exercise models or volatility surfaces. Compare the assumptions before comparing the percentage.
Can an implied volatility calculator return no result?
Yes. A quote outside theoretical bounds, an invalid time value, a stale adjusted contract or a solver that cannot converge may have no valid positive-volatility solution.
Does a high IV mean an option is a good buy?
No. High IV may mean a larger expected range or event premium, but it can also mean expensive time value and substantial risk. Review payoff, liquidity, vega and the reason for the premium.
What is the difference between IV and realized volatility?
Realized volatility is calculated from historical price returns. IV is solved from an option premium, so it is forward-looking in a market-implied sense and depends on a pricing model.
Should I use one IV for every strike?
Usually no. Options markets often show skew or a smile across strikes and maturities. Use the contract-specific IV or a clearly defined surface rather than copying one percentage everywhere.
Sources and page scope
The page structure was checked against current public calculator pages. Their section patterns informed the coverage, while the explanations here are written for transparent, model-aware education.
- FlashAlpha · Implied Volatility Calculator — Shows contract inputs, a client-side solver, Greeks and an IV explanation.
- Barchart · Options Calculator — Documents contract inputs and the difference between pricing models.
- Options Industry Council — A public education reference for implied volatility concepts and risk context.